


Abstract
Background. Due to emergency care overcrowding, right care at the right place and time is necessary. Uniform triage of patients contacting different emergency care settings will improve quality of care and communication between health care providers.
Objective. Validation of the computer-based Netherlands Triage System (NTS) developed for physical triage at emergency departments (EDs) and telephone triage at general practitioner cooperatives (GPCs).
Methods. Prospective observational study with patients attending the ED of a university-affiliated hospital (September 2008 to November 2008) or contacting an urban GPC (December 2008 to February 2009). For validation of the NTS, we defined surrogate urgency markers as best proxies for true urgency. For physical triage (ED): resource use, hospitalization and follow-up. For telephone triage (GPC): referral to ED, self-care advice after telephone consultation or GP advice after physical consultation. Associations between NTS urgency levels and surrogate urgency markers were evaluated using chi-square tests for trend.
Results. We included nearly 10 000 patients. For physical triage at ED, NTS urgency levels were associated with resource use, hospitalization and follow-up. For telephone triage at GPC, trends towards more ED referrals in high NTS urgency levels and more self-care advices after telephone consultation in lower NTS urgency levels were found. The association between NTS urgency classification and GP advice was less explicit. Similar results were found for children; however, we found no association between NTS urgency level and GP advice.
Conclusions. Physically and telephone-assigned NTS urgency levels were associated with majority of surrogate urgency markers. The NTS as single triage system for physical and telephone triage seems feasible.
Introduction
In the Netherlands, out-of-hours emergency care is provided by general practitioner cooperatives (GPCs), emergency departments (EDs) and ambulance services. In emergency situations, patients can call the national emergency number, answered by the ambulance dispatch centre (ADC), phone the GPC or visit the GPC or ED on their own initiative.
Efforts to concentrate primary out-of-hours care (development of GPCs), increasing assertiveness of patients to refer themselves to the ED and longer throughput times at the ED have lead to emergency care overcrowding.1–3 To prevent harm, it is important to distinguish patients who need immediate medical attention from those who can wait safely. Currently, different triage systems are used to achieve this goal. EDs mainly use the Manchester Triage System (MTS),4–7 GPCs the National Telephone Guide of the Dutch College of General Practitioners (NTG)8 and ADCs the National Standard for Dispatch Centre Ambulance Care (LSMA).9
In order to improve the right care at the right place and time, as well as provide better communication between health care organizations, it is more favourable to triage each patient uniformly, regardless of the health care provider contacted.10,11 For this purpose, a new standardized computer-based five-level triage system, the Netherlands Triage System (NTS), has been developed for both physical triage at the ED and telephone triage at the GPC and ADC.
The NTS showed substantial reliability. We recently conducted an inter-rater agreement study, consisting of 55 written case scenarios (adult and child), triaged by 20 ED and 30 GPC nurses with a stand-alone computer application of the NTS. The results showed a quadratically weighted kappa of 0.63 [95% confidence interval (CI) 0.53–0.73] for ED nurses and 0.67 (95% CI 0.57–0.77) for GPC nurses (M van Veen, personal communication) comparable to other triage systems used worldwide.6,12–17 Validation studies ideally evaluate whether triage systems accurately categorize patients in true urgency levels.18 Unfortunately, no single measure captures this concept and one needs to select a best proxy for true urgency, e.g. by defining a reference standard6,19 or surrogate marker(s) of urgency, such as resource use,12,19–22 ED length of stay,12,21–24 hospitalization12,15,19–24 or costs.21,24
The aim of this study was to validate physical and telephone triage by the NTS, using surrogate urgency markers as a best proxy for true urgency. Results for children were analysed separately since children constitute 25–30% of the workload of out-of-hours emergency care in the Netherlands25 and validity of other triage systems has been shown to differ substantially between adult and paediatric patients.6,17
Methods
Netherlands Triage System
The NTS is a computer-based standardized five-level triage protocol, derived from the MTS, NTG and LSMA.26 It is, like most triage systems, primarily based on expert opinion and consensus. The NTS consists of 56 presenting problems with 238 different triage criteria (signs and symptoms). When vital signs (airway, breathing, circulation and consciousness) are threatened, Urgency Level 1 is applicable. If not, after selection of the main complaint and discriminators (triage criteria), one of the remaining four urgency levels is advised (Fig. 1) (L Huibers, personal communication).
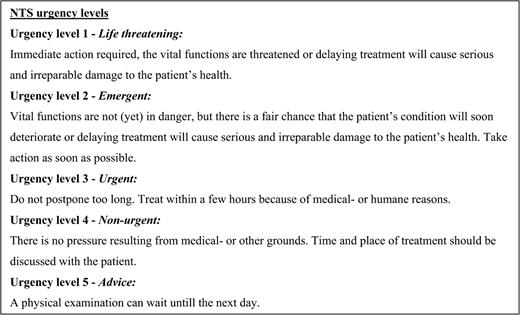
Definitions of the NTS urgency levels
Study setting
This observational study was conducted at an urban ED and GPC located in the centre of the Netherlands. The ED belongs to a regional university-affiliated hospital and is 24-hour covered. The GPC can be contacted by all patients living in a specified postal code area surrounding the GPC, outside regular service hours of the patient’s own GP practice (weekdays from 5 p.m. till 8 a.m. and weekends from Friday 5 p.m. till Monday 8 a.m.). Annually, the ED is visited by ∼20 000 patients and the GPC receives ∼60 000 calls. All GPC and ED nurses had previous experience with triage and received a standardized training how to apply the NTS. Triage with the NTS started in October 2007 at the ED and May 2008 at the GPC.
Study population
Triage and corresponding electronic medical records of patients attending the ED from September till November 2008 or contacting the GPC from December 2008 till February 2009 were collected. Medical records were extracted from the Hospital Information System at the ED and Call Manager at the GPC, both computer databases containing medical patient information. Relevant data from GPC records were recorded by two medical students, blinded for the assigned NTS urgency level of the patient, using SPSS Data builder and Data entry (SPSS Version 15.0; SPSS Inc., Chicago, IL). For all patients, information on gender, date of birth, date of contact with ED or GPC, mean patient load/hour at the moment of contact, self-referral and urgency level was collected. Nurses were asked to triage all patients with the NTS; still for logistical reasons, the previously used triage tools (MTS at the ED and NTG at GPC) were also kept available. Only NTS-triaged patients were selected for the validation analysis.
Validation analysis
We defined surrogate markers of urgency (outcome measures) as best proxy for the patient’s true urgency. For the ED setting: (i) resource use: laboratory blood test, simple radiological examination (X-ray or ultrasound) and advanced radiological examination [computed tomography (CT) scan or magnetic resonance imaging (MRI) scan]; (ii) hospital admission: medium and intensive care units (MCU and ICU) and (iii) follow-up at outpatient clinic or GP. Patients transferred to another hospital (n = 25) were assumed to be admitted to the MCU. Due to smaller sample size, for children, the ED markers were defined as: (i) resource use: laboratory blood test and radiological examination, (ii) hospital admission (MCU + ICU) and (iii) follow-up at outpatient clinic or GP.
After telephone triage at the GPC, the triage nurse could decide to give the patient either a telephone consultation [i.e. immediately send an ambulance, give a (medical) advice herself or let the GP call the patient] or a physical consultation (i.e. advise the patient to visit the GPC or organize a GP home visit). For the telephone consultation group, we defined two surrogate urgency markers: (i) referral to ED (with or without ambulance) and (ii) self-care advice [advice after telephone consultation by triagist/GP, with or without self-care medication (e.g. paracetamol, oral rehydration solution) and without prescription of other medication or referral to hospital]. For the physical consultation group, we defined the following surrogate urgency markers: (i) referral to ED (with or without ambulance) and (ii) GP advice (advice after physical consultation by GP, with or without self-care medication but without prescription of other medication, diagnostics, interventions or referral to hospital). Decisions on diagnostics, therapy and follow-up were made by the treating physicians, independently of the assigned NTS urgency.
Data analysis
We performed analysis for the total patient population and paediatric patients separately (age ≤16 years). For comparison of general patient characteristics between NTS- and no-NTS-triaged patients, Pearson’s chi-square and Mann–Whitney U-tests were used where appropriate. For trends, Pearson’s chi-square linear-by-linear association was used. P values <0.05 were considered significant. Statistical analysis was performed using SPSS Version 15.0.
Results
Compliance
The ED was visited by 5209 patients. Among them, 3300 patients were triaged with the NTS (63%) of which 3207 records were available for analysis (Fig. 2). The GPC was contacted by 11 045 patients. Among the 6952 (63%) patients triaged with the NTS, 6668 GPC records were available for analysis (Fig. 2). Due to logistic reasons, both the NTS and the previously used triage tools (MTS at ED and NTG at GPC) were available for triage. Reasons why nurses triaged the remaining part of the patients with the previous tools were not evaluated. Comparison of general patient characteristics between NTS- and MTS- or NTG-triaged patients at both locations showed no differences for gender and median patient load/hour at the moment of contact (data not shown). NTS-triaged patients were slightly younger than patients triaged with the previously used triage tools (median age: ED 39 versus 44 years, P < 0.001; GPC 27 versus 36 years, P < 0.001). At the ED, more self-referred patients were NTS triaged (42% versus no NTS 34%; P < 0.001). Comparison of urgency distributions between NTS and MTS/NTG could not be made, due to different definitions of the urgency categories.
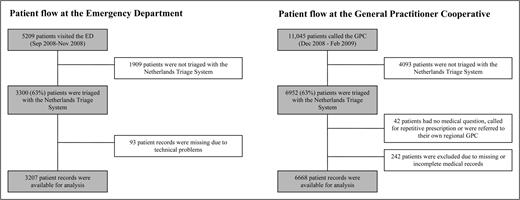
Patient flows at the ED and GPC
Validation analysis
Physical triage at the ED
Table 1 displays the NTS urgency classification of all patients visiting the ED and the presence of surrogate urgency markers. A trend of increase in resource use, hospital admission and follow-up at the outpatient clinic towards the higher urgency categories was observed (Ptrend < 0.001). Follow-up visits at the GP were more frequently seen in the lower NTS urgency levels compared to the higher levels (Ptrend < 0.001). For paediatric patients, similar trends were found, although numbers were smaller (Table 2).
NTS urgency distribution of the total ED population and surrogate urgency markers
| Resource use (N; %) | Admission (N; %) | Follow-up (N; %) | ||||||
| NTS urgency | N | Laboratory blood test | Radiology | Admission to hospital | Follow-up visit | |||
| X-ray and/or ultrasound | CT scan and/or MRI scan | MCU | ICU | Outpatient clinic | GP | |||
| 1 | 150 | 124 (82.7) | 104 (69.3) | 18 (12.0) | 66 (44.0) | 53 (35.3) | 102 (68.0) | 3 (2.0) |
| 2 | 754 | 447 (59.3) | 406 (53.8) | 39 (5.2) | 367 (48.7) | 40 (5.3) | 514 (68.2) | 10 (1.3) |
| 3 | 1394 | 352 (25.3) | 648 (46.5) | 21 (1.5) | 282 (20.2) | 19 (1.4) | 823 (59.0) | 168 (12.1) |
| 4 | 462 | 99 (21.4) | 153 (33.1) | 8 (1.7) | 86 (18.6) | 4 (0.9) | 238 (51.5) | 124 (26.8) |
| 5 | 447 | 79 (17.7) | 107 (23.9) | 4 (0.9) | 57 (12.8) | 2 (0.4) | 168 (37.6) | 170 (38.0) |
| Total | 3207 | 1101 (34.3) | 1418 (44.2) | 90 (2.8) | 858 (26.8) | 118 (3.7) | 1845 (37.5) | 475 (14.8) |
| Ptrend | <0.001 | <0.001 | <0.001 | <0.001 | <0.001 | <0.001 | <0.001 | |
N, number of patients; GP, general practitioner. Ptrend, P-values for trend calculated with Pearson's Chi Square linear-by-linear association.
NTS urgency distribution of paediatric ED patients and surrogate urgency markers
| Resource use (N; %) | Admission (N; %) | Follow-up (N; %) | ||||
| NTS urgency | N | Laboratory | Radiology | Admission to hospital | Outpatient clinic | GP |
| 1 | 10 | 5 (50.0) | 5 (50.0) | 6 (60.0) | 6 (60.0) | 1 (10.0) |
| 2 | 120 | 41 (34.2) | 55 (45.8) | 46 (38.3) | 69 (57.5) | 2 (1.7) |
| 3 | 347 | 46 (13.3) | 155 (44.7) | 42 (12.1) | 179 (51.6) | 37 (10.7) |
| 4 | 104 | 14 (13.5) | 37 (35.6) | 10 (9.6) | 45 (43.3) | 23 (22.1) |
| 5 | 120 | 6 (5.0) | 28 (23.3) | 4 (3.3) | 37 (30.6) | 49 (40.8) |
| Total | 701 | 112 (16.0) | 280 (39.9) | 107 (15.3) | 336 (47.9) | 112 (16.0) |
| Ptrend | <0.001 | <0.001 | <0.001 | <0.001 | <0.001 | |
N, number of patients; GP, general practitioner. Ptrend, P values for trend calculated with Pearson’s chi-square linear-by-linear association. Laboratory: any blood test performed; radiology: X-ray, ultrasound, CT scan or MRI scan; admission: MCU or paediatric intensive care unit.
Telephone triage at the GPC
After telephone triage by the GPC nurse, 35% of all patients only received a telephone consultation and 65% had a physical consultation at the GPC or at home. Similar proportions were observed for children (data not shown). For patients with a telephone consultation, a trend towards more ED referrals in the high urgency levels and more self-care advices in the low urgency levels was found (Ptrend < 0.001). In the physical consultation group, 23% (148/652) of the high-urgent patients (U1 + U2) were referred to the ED compared to 9% (142/1664) of the low-urgent patients (U4 + U5; Ptrend < 0.001). The association between NTS urgency classification and GP advice after physical consultation was, although significant (Ptrend < 0.001), less explicit (Table 3). Twenty-seven per cent (177/652) of high-urgent patients ended with a GP advice only compared to 34% (574/1668) of low-urgent patients.
NTS urgency distribution of the total GPC population according to the type of consultation and surrogate urgency markers
| Telephone consultation (N; %) | Physical consultation (N; %) | |||||
| NTS urgency | N | Referral to ED | Self-care advice | N | Referral to ED | GP advice |
| 1 | 56 | 52 (92.9) | 3 (5.4) | 57 | 18 (31.6) | 15 (26.3) |
| 2 | 92 | 27 (29.3) | 39 (42.4) | 595 | 130 (21.8) | 162 (27.2) |
| 3 | 521 | 33 (6.3) | 338 (64.9) | 1996 | 231 (11.6) | 591 (29.6) |
| 4 | 594 | 8 (1.3) | 457 (76.9) | 850 | 61 (7.2) | 284 (33.4) |
| 5 | 1093 | 16 (1.5) | 859 (78.6) | 814 | 81 (10.0) | 290 (35.6) |
| Total | 2356 | 136 (5.8) | 1696 (72.0) | 4312 | 521 (12.1) | 1342 (31.1) |
| Ptrend | <0.001 | <0.001 | <0.001 | <0.001 | ||
N, number of patients; GP, general practitioner. Ptrend, P values for trend are calculated with Pearson’s chi-square linear-by-linear association.
For paediatric patients, significant trends towards more ED referrals in the high urgency categories were observed in both consultation groups. A trend towards more self-care advices in low urgency levels was found for children with telephone consultation. No clear association could be demonstrated between NTS urgency level and GP advice after physical consultation (Table 4).
NTS urgency distribution of the paediatric GPC population according to the type of consultation and surrogate urgency markers
| Telephone consultation (N; %) | Physical consultation (N; %) | |||||
| NTS urgency | N | Referral to ED | Self-care device | N | Referral to ED | GP advice |
| 1 | 3 | 1 (33.3) | 2 (66.7) | 15 | 2 (13.3) | 8 (53.3) |
| 2 | 16 | 2 (12.5) | 12 (75.0) | 208 | 28 (13.5) | 103 (49.5) |
| 3 | 195 | 1 (0.5) | 173 (88.7) | 823 | 50 (6.1) | 377 (45.8) |
| 4 | 217 | 1(0.5) | 202 (93.1) | 308 | 20 (6.5) | 165 (53.6) |
| 5 | 407 | 1 (0.2) | 380 (93.4) | 255 | 15 (5.9) | 148 (58.0) |
| Total | 838 | 6 (0.7) | 769 (91.8) | 1609 | 115 (7.1) | 801 (49.8) |
| Ptrend | <0.001 | <0.004 | 0.015 | 0.004 | ||
N, number of patients; GP, general practitioner. Ptrend, P values for trend are calculated with Pearson’s chi-square linear-by-linear association.
Discussion
For the total patient population and children separately, NTS urgency levels assigned by physical triage at the ED were associated with resource use, hospital admission and follow-up visits. For telephone triage at the GPC, trends towards more ED referrals in the high NTS urgency levels and more self-care advices in the lower NTS urgency levels were found for the telephone consultation group. For the physical consultation group, an association between NTS urgency level and referral to ED was found; the association with GP advice was less explicit in the total patient population and absent for children.
We demonstrated that the majority of adult and paediatric patients assigned to NTS Urgency Level 1 by physical triage at the ED were hospitalized comparable to validation analyses of other triage systems used in ED settings (Table 5).12,15,19–23 The proportion of hospital admissions among low-urgent patients was somewhat higher compared to these studies. For the association between urgency level and resource use, similar results are described for other triage systems as well, although definitions are not completely concordant (Table 5). Since many triage systems required separate validation analyses for children in order to improve the system,27 we simultaneously performed these analyses in our study. Overall, our results suggest that the NTS might be a valid triage tool for physical triage at the ED.
Studies on validity of triage systems in hospital emergency care making use of surrogate markers of urgency
| Adults (%) | Children (%) | |||||||||||||
| Triage system | CTAS(21) | CTAS(22) | ESI(15) | pCTAS(20) | pCTAS(23) | CTAS(22) | ESI(12) | MTS(19) | ||||||
| Number of patients | 29 524 | 23 099 | 403 | 1281 | 58 529 | 9162 | 510 | 1065 | ||||||
| Urgency markersa | Hospital admission | Hospital admission | Resource use | Hospital admission | Hospital admission | Resource use | Hospital admission | Hospital admission | Laboratory test | Radiology | Hospital admission | Resource use | Hospital admission | Resource use |
| Urgency Level | ||||||||||||||
| 1 | 83 | 70 | 85 | 80 | 100 | 100 | 63 | 83 | 67 | 83 | 80 | 100 | 54 | 87 |
| 2 | 41 | 54 | 81 | 73 | 24 | 29 | 37 | 23 | 28 | 28 | 34 | 76 | 29 | 71 |
| 3 | 23 | 29 | 57 | 51 | 12 | 25 | 14 | 12 | 14 | 23 | 13 | 63 | 16 | 73 |
| 4 | 10 | 7 | 24 | 6 | 4 | 15 | 2 | 2 | 6 | 17 | 3 | 51 | 6 | 59 |
| 5 | 5 | 3 | 7 | 5 | 2 | 11 | 1 | 1 | 2 | 37 | 0 | 15 | 1 | 32 |
ESI, emergency severity index; (p)CTAS, (paediatric) Canadian triage and acuity scale.
Urgency markers were defined as follows: (21): Hospital admission: all admissions, transfers and deaths. (22): Hospital admission: all hospitalizations and transfers; laboratory test: not specified; radiology: not specified. (15): Hospital admission: MCU, ICU, telemetry and deaths. (20): Hospital admission: not specified; resource use: complete blood count. (23): Hospital admission: MCU. (12): Hospital admission: MCU, ICU, transfer and deaths; resource use: cardiac monitoring, specialty consultation, electrocardiography, laboratory test, radiology test, fluid or medication or blood product administration, mechanical ventilation. (19): Hospital admission: not specified; resource use: laboratory tests, radiology tests, medication or intervention at ED.
Similar to the UK, all GPC calls in the Netherlands are initially answered by a triage nurse, who decides what type of consultation the patient requires.28 The distribution of telephone and physical consultations in our study is comparable to previous reports.3,25,29 Telephone triage and telephone consultation by nurses instead of physicians appeared to be efficient and safe.30–32 Still, validation analyses of telephone triage tools are scarce. Previously, two Dutch studies evaluated whether triage nurses, using a paper version of the NTG, correctly estimated urgency levels for telephone incognito standardized patients compared to a predefined expert opinion-based urgency level. Giesen et al.33 reported that 118 triage nurses from four GPCs correctly estimated the level of urgency in 69% of 352 calls (20 different clinical cases). Derkx et al. showed that triage nurses from 17 GPCs achieved the appropriate triage outcome in only 58% of 357 calls (seven different clinical cases). The number of obligatory questions asked was consistently below the previously defined standard.34 It has been suggested that the safety of telephone triage may be enhanced by using computer-based decision support systems.34–36 Dale et al.37,38 demonstrated feasibility of a computerized decision support system for emergency ambulance calls. Likewise, in out-of-hours primary care and Children’s Hospitals in the UK and USA, nurse telephone triage and consultation, using computerized decision support, have been reported to be a safe and effective gatekeeper as well.30,39
Unfortunately, GPCs, EDs and ADCs from all over the world use different triage tools to categorize patients according to their urgency. Unequal definitions of urgency levels obviously hamper communication and collaboration between (emergency) health care providers, which is essential to guarantee quality and safety, especially in times of increasing emergency care overcrowding. Uniform triage may be one solution for this problem. Similar definitions and understanding of triage criteria used for urgency level assignment will improve collaboration. For example, this will potentiate referral of non-urgent patients from the ED to alternative care settings more appropriate for the patient’s presenting problem and urgency, like the fast-track area within the ED, the GPC or the patient’s own GP.40 Besides, patients will only be triaged once and uniformly regardless of the health care provider contacted, which may result in improved patient satisfaction, health care efficiency and decreased health care costs.10
Strengths and limitations
Due to the lack of a golden standard for true urgency, one must choose a second best method to validate a triage system.18 Like studies validating the MTS, (paediatric) Canadian Triage and Acuity Scale and Emergency Severity Index,12,15,19–24 we used surrogate urgency markers as a best proxy for true urgency. These markers, however, do not indicate the exact number of patients (potentially) harmed. To evaluate the safety of the NTS, we previously conducted a retrospective pilot study (L Huibers, personal communication). Two independent reviewers identified 18 (5.6%) out of 319 randomly selected GPC and 8 (2.1%) out of 375 randomly selected ED contacts to be potentially unsafe. A potentially unsafe incident was defined as an unintended event during the care process that resulted, could have resulted or still might result in harm to the patient [criteria for inclusion of incidents: (i) acts of omission, (ii) acts of commission, (iii) related to unnecessary harm or risk for the patient, (iv) harm is mainly thought of as somatic or serious psychiatric diseases and (v) risk has to be scientifically proven or broadly accepted as valid; exclusion criteria: (i) minor psychological harm or (ii) events completely caused by the patient him/herself].41,42 An independent physician panel then assessed that triage with the NTS was a possible cause in three (1%) of these GPC and two (0.5%) of these ED contacts. These preliminary results raise no major doubts about the safety of the NTS. Still more extensive critical event analyses must be performed to confirm these findings on a larger scale.
Since we know that the predictive value of a certain discriminator (e.g. triage criterion) for high urgency might be different in settings with different disease prevalences,43 we performed our validation analysis in both the ED and the GPC setting. By our best knowledge, we are the first to validate a standardized computer-based telephone triage tool at the GPC for the whole spectrum of presenting problems, using surrogate urgency markers. Even though such markers have been widely used to validate triage systems in ED settings,12,15,19–24 they have never been described for telephone triage in primary care. Due to minor availability of diagnostic tests and interventions in primary care, it is difficult to define adequate surrogate markers for telephone triage at the GPC, which may somewhat limit the choice of proxy markers for urgency. Triage was performed by experienced nurses, as evidenced by a substantial inter-rater agreement44 at both settings [ED: kappa 0.67 (95% CI 0.53–0.73) and GPC: kappa 0.63 (95% CI 0.57–0.77)] comparable to previous triage tools.12–17,27 Compliance to triage with the NTS was good. Patient characteristics between NTS- and no-NTS-triaged patients were mainly comparable at both the ED and the GPC and selection bias seems unlikely, however, cannot be ruled out. The high number of patients included from the large regional inner-city GPC and ED constitute a good case mix and results seem generalizable to other general patient populations. Still, larger study populations are desirable to enable validation analyses of specific patient subgroups, as described before.6 This will identify patients for which the NTS currently has a low performance and where modifications of the triage system are required.
Conclusion and implications for future research
Our study demonstrates that both physically and telephone-assigned NTS urgency levels were associated with the majority of urgency markers for the total patient population and children separately. Still, some over and under triage may have occurred. To specify over and under triage by the NTS, either incognito standardized patients must be used33,34 or an independent reference standard (‘silver standard’ for true urgency) must be defined.6 Still, the NTS as a single triage system for both physical and telephone triage seems feasible. Larger study populations will enable validation analysis of patient subgroups, which will guide specific modifications of the triage system to improve its performance.
Declaration
Funding: Ministry of Health, Welfare and Sport (VWS), The Netherlands (1213016) and the Dutch Organisation for Scientific Research (ZonMw; 8271.0001).
Ethics approval: All patient information was anonymous and ethics approval was waved.
Conflict of interest: none.
We thank the NTS project group for implementation of the NTS at both study locations, B Leferink and S Sloot of the Scientific Institute for Quality of Healthcare, UMC St Radboud, Nijmegen, Netherlands, for technical support and all employees of the participating health care organizations for their cooperation in this study.
